
Pro-active monitoring is a type of monitoring that involves the use of tools and techniques to identify potential problems before they become critical issues. This approach helps your organization to stay ahead of potential issues and resolve them before they have a significant impact on the performance of your systems and applications.
While reactive monitoring detects failures after something has gone wrong, proactive monitoring alerts you to potential issues before the issue becomes a failure. At SolaDrive, tools for proactive monitoring are made available for all clients. In this article, we'll cover some advanced features of proactive monitoring and how you can use it to keep your managed hosting service running smoothly.
Step 1: Log in to your client area. To access the login page, go to https://www.soladrive.com/support/login to pull up the page below.
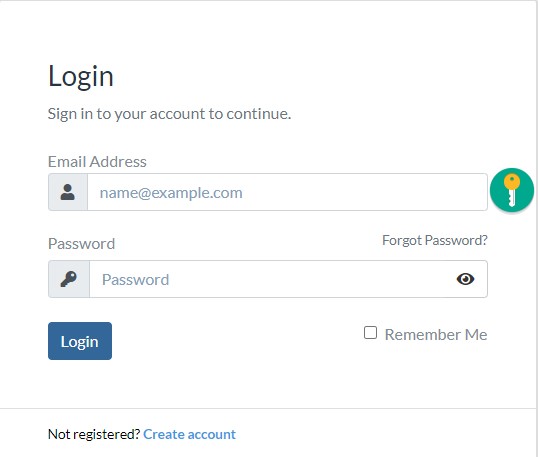
Enter your login credentials and click on the "Login" button. If you are unsure about your credentials, you can contact support over the live chat on the bottom right-hand side of the page. If you do not have an account, you can go ahead and click on "Create account" below the "Login" button to create one.
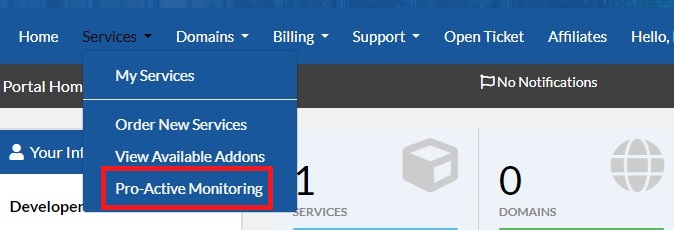
Step 2: Once logged in to your client area, navigate to the proactive monitoring page by clicking on "Services" > "Pro-Active Monitoring" as shown below.
You will arrive at the proactive monitoring dashboard shown below. Note that some monitors have already been configured for this account. Yours might not show any monitors. However, you will see all the products/services that you have subscribed to. You can create monitors for each product.
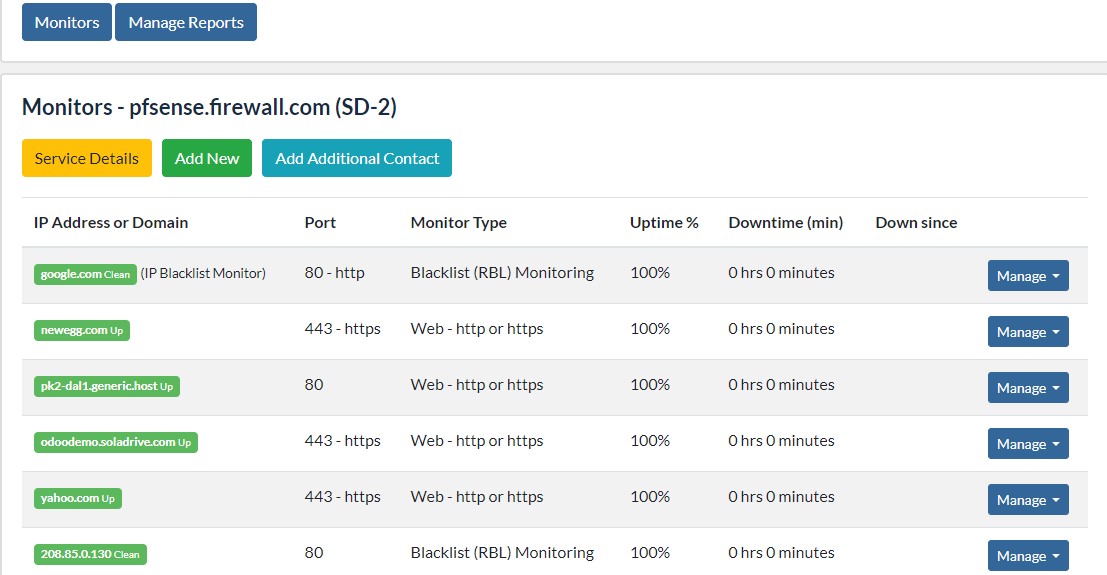
Under each product, you will see three buttons as shown above, the first button (Service Details), when clicked, will show you the product/service in detail. The second button (Add New) can be used to create a new monitor for the product/service. The third button (Add Additional Contact) can be used to manage the list of contacts for this product/service.
Step 3: Adding a monitor. Click the "Add New" button under the product/service to create a new monitor. You will see the following interface.
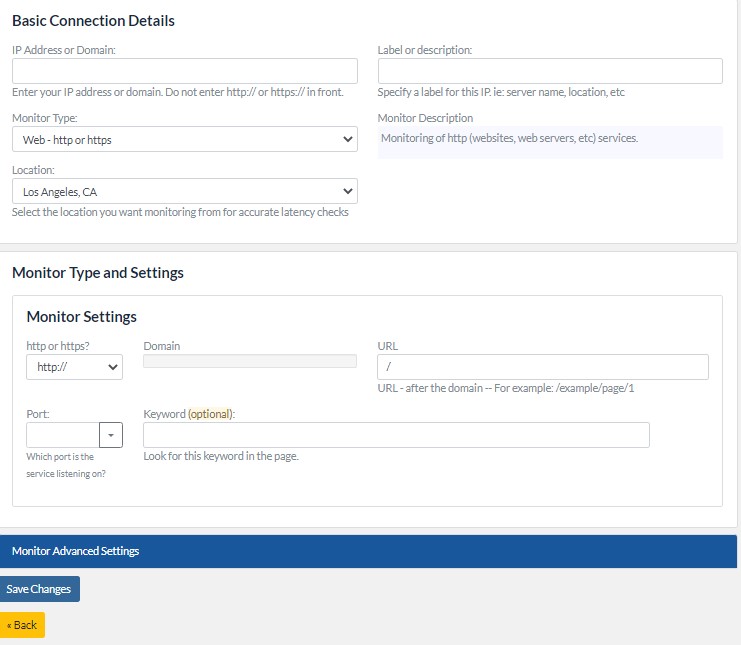
Under the "Basic Connection Details", in the first input of the form, you will enter the domain name or IP address of the resource you want to monitor. You can then select the "Monitor Type" from the dropdown. The options here are:
- Web -http or https - The HTTP monitor tests the ability of a web server to accept incoming sessions and conduct a transaction. The HTTPS monitor performs the same test but over a secure connection. If the web server doesn’t respond within the required number of seconds, it’s considered a failure. By using an HTTP monitor, you can more easily avoid having end users be the first ones to report an issue to you.
- Port - This monitor checks for successful connection to any port. This can be used to check any port without knowing the protocol (service) used on that port,
- Ping (ICMP) - The ping monitor is a basic network test for successful connections to the resource.
- TLS (SSL) Certificate - This monitor checks for the validity of TLS (SSL) Certificates -- expiration, and peer verification.
- Blacklist (RBL) Monitoring - This monitors blacklists for the IP or domain given.
Each of these monitors has an extra section below labeled "Monitor Type Settings" where you get to set different monitoring parameters for each type of monitor. Make sure you set the parameters precisely according to how you want the monitor to operate.
In the next input, you can select the location from where you want to run the monitor. This allows you to be able to more accurately check for latency.
On the right-hand side, you can enter a label for this monitor depending on whatever criteria you wish.
Lastly, you will see an accordion-style section labeled "Monitor Advanced Settings". This section allows you to set the frequency with which the monitor performs its task and the time period the monitor should wait before declaring a timeout.
Click on "Save Changes" to save your newly configured monitor. Now, this new monitor will show in the "Pro-Active Monitoring" dashboard.
Step 4: Manage your monitors. On the "Pro-active Monitoring" dashboard, you can see every monitor that you've created under the corresponding product/service. On the right-hand side of each monitor, you will see a "Manage" button as shown below:
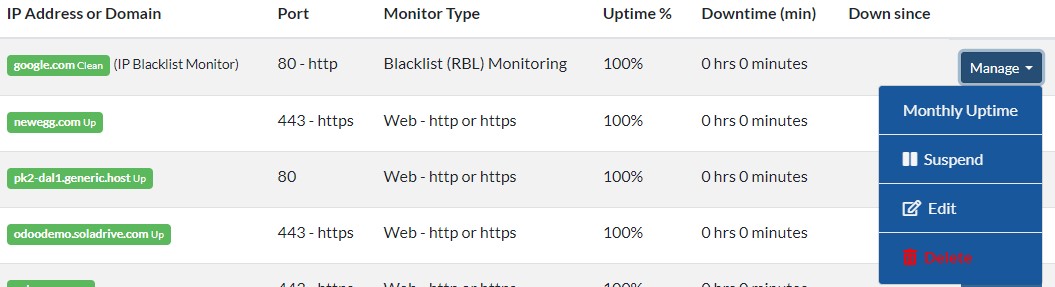
From here, you can check the monthly uptime chart, suspend the monitor, edit the monitor to change some parameters, or delete the monitor.
These are the basics of the proactive monitoring tool that will enable you to have a realtime view of the status of your products and services on SolaDrive.